In my search for a way to display the data being collected by Homey I often have seen Grafana as an option. Grafana is a tool to visualize data in graphs, gauges, tables, etc. It reads data from a database, is very responsive and easy to work with. As a bonus, FreeNAS offers a community plug-in which has both Grafana and InfluxDB installed and ready to go, so I could easily set up a jail to try it out.
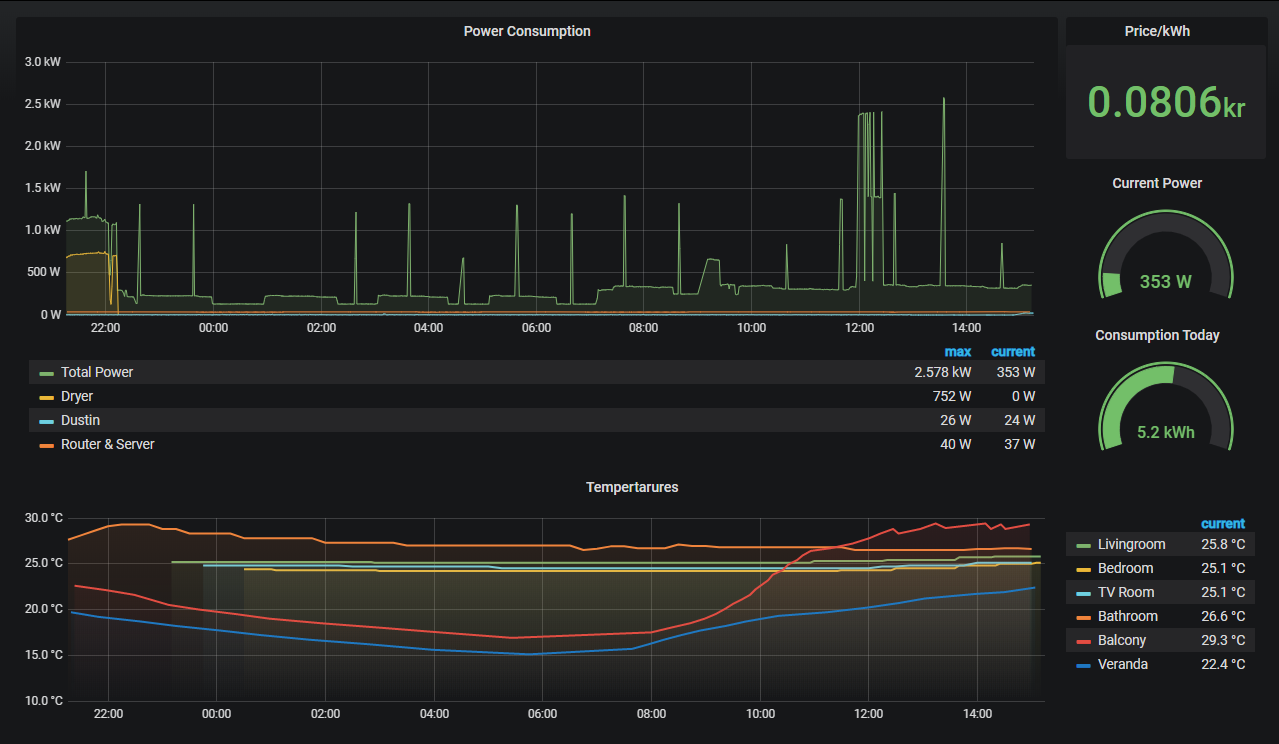
Homey by itself does not log any data. To have it upload its variables to the InfluxDB database I just had to install the InfluxDB App, fill in the IP address of the Grafana jail & credentials of the database, et voila! From the Grafana interface I started seeing the potential Query fields being populated with all the data that Homey had to offer. Not much time after that, I had my first Dashboard populated with energy measurements, real-time power consumption and temperature data from different rooms in the house. With a little more playing around this Dasboard was shown as an iframe on my Magic Mirror.

After doing this I realized that FreeNAS is also a great source of data (CPU usage, network & HDD speeds, RAM usage etc.) and a place where I’d like to get some more overview of what’s happening. Naturally, a quick Google-search yielded tons of people who had done this before, and I followed this guide to get FreeNAS to upload its data to a separate InfluxDB database and create a Dashboard in Grafana. I then used this dashboard as an inspiration to create a similar one for Homey and by the end of the day I had 3 different dashboards which give me a neat insight in how well my core-components from my smart home are working.
An additional line in the reverse proxy configuration and the Grafana jail was accessible through the internet. Curious on how it looks? You can find it here: cloud.jessendelft.org/grafana/.
Username: viewer
Password: viewer123
I am not sure yet if I want to keep using this system, as I ultimately want some form of 2D/3D interactive map of my house to show this information. As an interim solution though, this is quite nice and I was surprised by how easy it was to include this in my system. I like the fact that all the ground-work is up and running (FreeNAS, Reverse Proxy, Homey, etc.), and that it apparently is working so well that it is easy to build layers of complexity upon them with for example the Grafana dashboards. If you have comments/ideas on what I can do with my data, or how I can improve my system even more, please let me know in the comments!
Cheers!
Jesper